Navigation: On the landing page, select COMPARISON REPORT.
This report allows you to compare the data in the source database and in the AE database.
To view the report, select a portfolio, scenario, and assets from your AE database to compare to Yardi.

1. In the PORTFOLIO drop-down list select an AE portfolio.
Result: The Scenarios panel populates.
2. Select a scenario.
Result: The detail panel populates with a list of properties.
3. Click checkboxes to select one or more property.
4. Click NEXT.
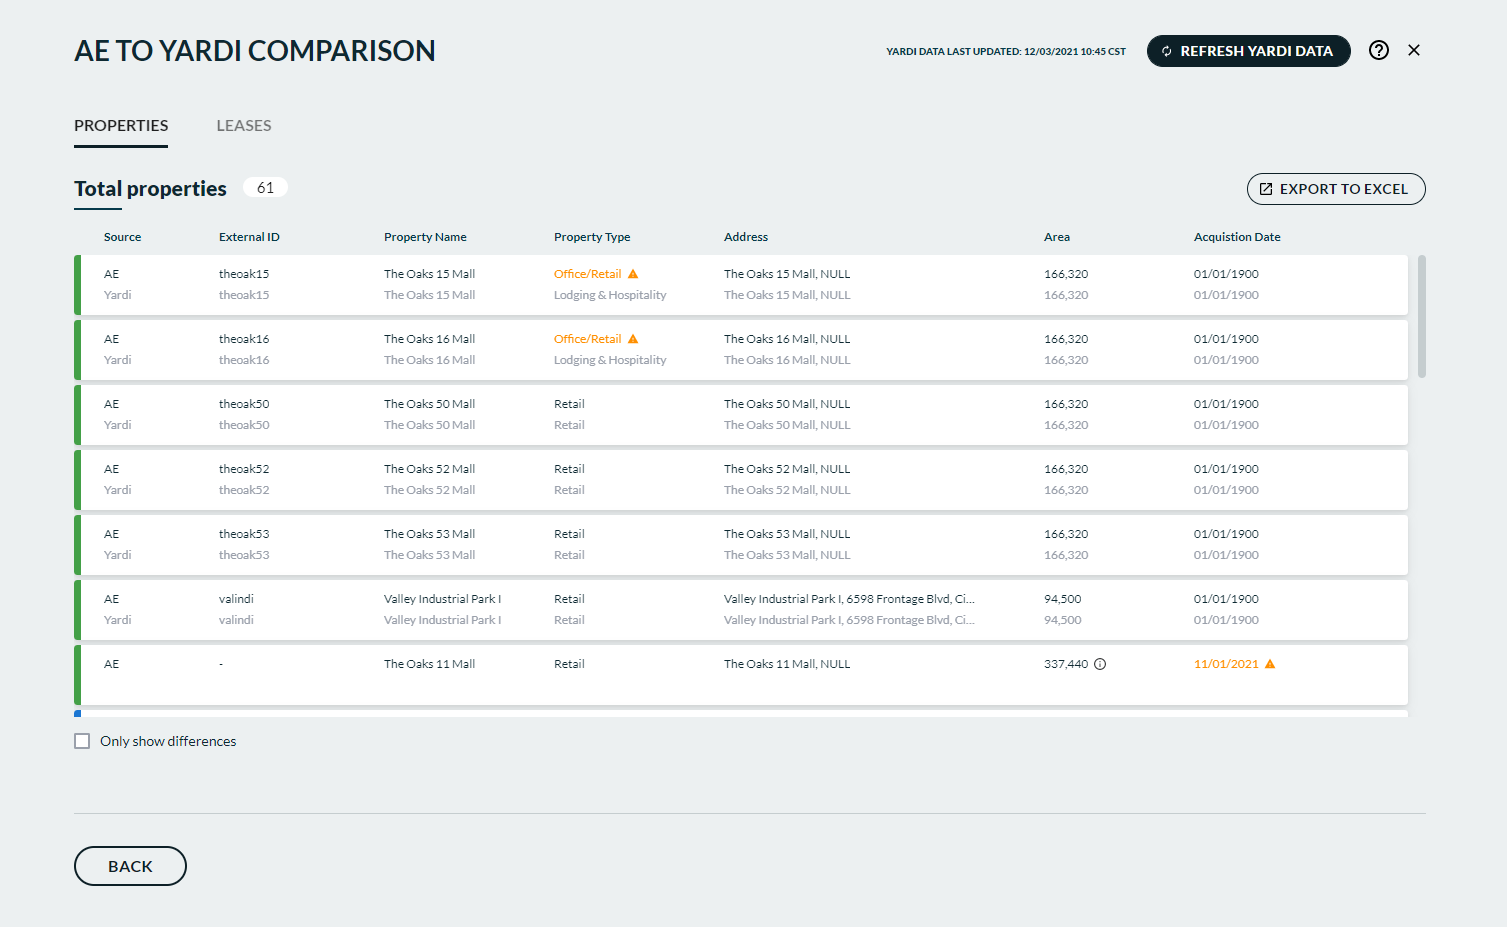
Result: The AE TO YARDI COMPARISON screen displays.
The report displays the matched AE and Yardi properties. Matches are made from the AE EXTERNAL ID.
At the top right of the screen a timestamp displays showing the user's region and time zone with the date of the last manual data request. IMPORTANT: If you have never made a manual data request then you will not see Yardi data on the Comparison Report.
Click the REFRESH YARDI DATA button to make a manual data request and update the Yardi information shown on the PROPERTIES tab.
Result: A progress bar displays with percentage completion and the number of properties being processed.
IMPORTANT: In the event a data refresh issue occurs you will see an error screen advising you to contact either Yardi Support or ARGUS Support. You can then proceed with any previously timestamped data.
Click CANCEL to cancel the data refresh. You can continue with any previously timestamped data.
Note: This will also update the LEASES tab information and the timestamp display at the same time.
Select EXPORT TO EXCEL to send the data to an Excel workbook with sheets for PROPERTIES and LEASES.
• Matches display a green row left border.
• AE properties without a matched Yardi property will display a gray row left border.
• Yardi properties without a matched AE property will display a blue row left border.
• Data differences display a data warning icon.
• The list can be sorted by any column header: Source, External ID, Property Name, Property Type, Address, Area, Acquisition Date.
Click the Only show differences checkbox to display only rows with differences.

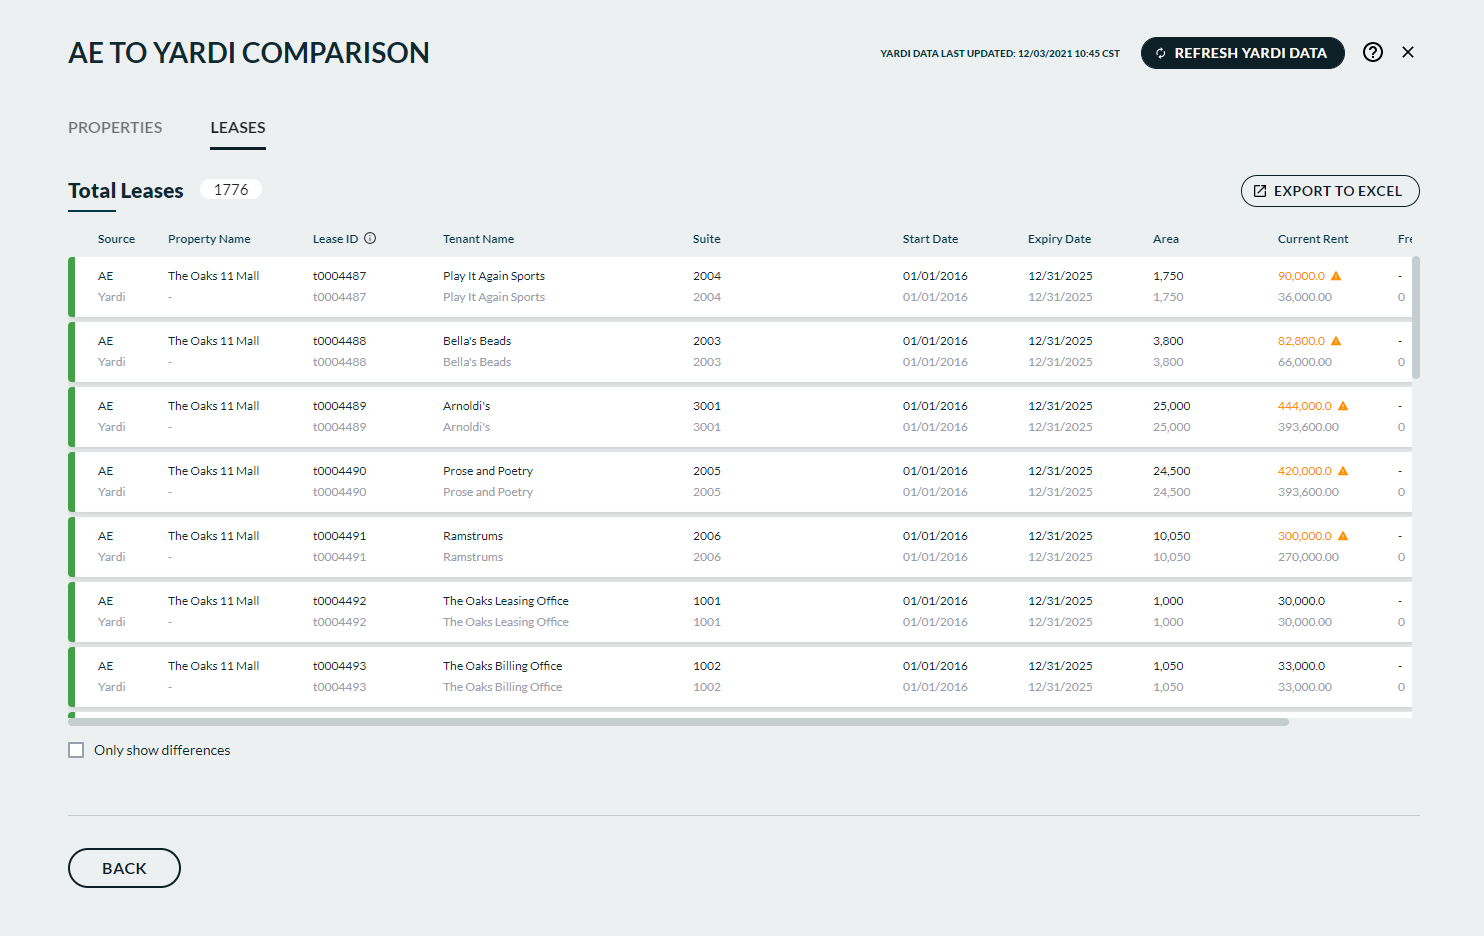
The report displays the matched AE and Yardi leases. Matches are made from the LEASE ID.
At the top right of the screen a timestamp displays showing the user's region and time zone with the date of the last manual data request. IMPORTANT: If you have never made a manual data request then you will not see Yardi data on the Comparison Report.
Click the REFRESH YARDI DATA button to make a manual data request and update the Yardi information shown on the LEASES tab.
Result: A progress bar displays with percentage completion and the number of properties being processed.
IMPORTANT: In the event a data refresh issue occurs you will see an error screen advising you to contact either Yardi Support or ARGUS Support. You can then proceed with any previously timestamped data.
Click CANCEL to cancel the data refresh. You can continue with any previously timestamped data.
Note: This will also update the PROPERTIES tab information and the timestamp display at the same time.
Select EXPORT TO EXCEL to send the data to an Excel workbook with sheets for PROPERTIES and LEASES.
• Matches display a green row left border.
• AE leases without a matched Yardi lease will display a gray row left border.
• Yardi leases without a matched AE lease will display a blue row left border.
• Data differences display a data warning icon.
• The list can be sorted by any column header: Source, Property Name, Lease ID, Tenant Name, Suite, Start Date, Expiry Date, Area, Current Rent, Free Rent (Months).
Leases which are assigned a BLOCKING TENANT CLASSIFICATION will be displayed as gray rows.
Click the Only Show Differences checkbox to display only rows with differences.
